
Unlock Competitive Advantage with Strategic Benchmarking in Brazil.
Brazil’s scale can make performance differences look obvious when the underlying comparison is not.
A competitor may appear to have lower costs because it operates at greater volume, produces locally, serves a denser customer base, concentrates on fewer states, carries a different product mix, or uses distributors for activities your company performs directly.
A business unit may look more productive because it serves São Paulo and nearby industrial corridors, while another team covers customers across distant states with greater travel, inventory, service, and logistics requirements. A manufacturer may appear more efficient because its tax, sourcing, production, and commercial flows are structured differently.
If those factors are not normalized, your leadership team may act on the wrong gap. You may cut resources that are supporting customer value, copy a model that does not fit your footprint, or pursue a cost target that assumes scale or capacity utilization you do not have.
At Midas Consulting, we help you compare performance in Brazil with the context required to interpret it correctly. We reconstruct how selected competitors, internal units, channels, plants, or reference organizations operate; normalize the material differences; explain the capabilities and choices behind stronger results; and identify what your company should match, adapt, redesign, leapfrog, or leave unchanged.
The result is not a ranking. It is a focused improvement agenda with realistic targets, strategic trade-offs, implementation requirements, and a clearer path from insight to measurable performance.
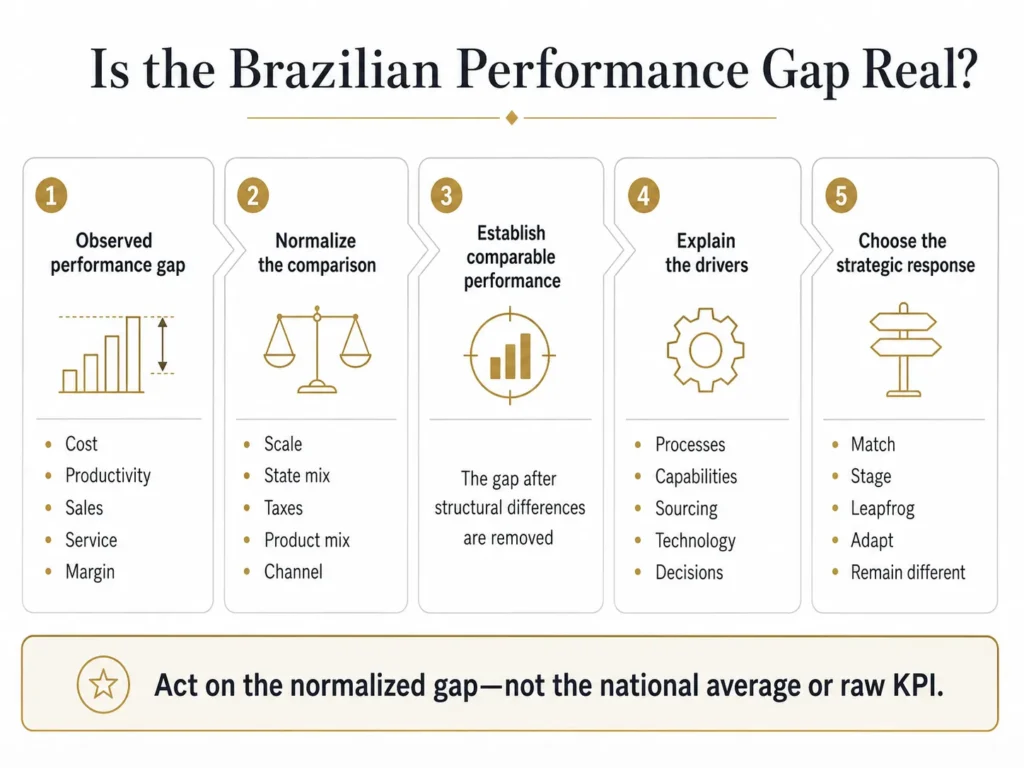
Figure 1. Benchmarking in Brazil should separate structural differences from the performance gap your organization can realistically address.
The Strategic Benchmarking Question in Brazil Is Not “Who Has the Best Number?”
A lower unit cost, faster response time, higher sales-per-employee figure, or stronger margin can be useful evidence. It is not a complete explanation.
Your leadership team needs to understand:
- Whether the companies or business units serve comparable regions, customers, and applications.
- How much scale and capacity utilization explain the difference.
- Whether taxes, commercial flows, or production location distort the comparison.
- How freight, inventory, service, and geographic coverage affect cost-to-serve.
- Whether one company produces locally while another imports finished products or components.
- How product and customer mix affect margin, productivity, and complexity.
- Which activities are performed internally and which are delegated to distributors, dealers, integrators, or contractors.
- What labor, organizational, technology, and decision-right differences influence execution.
- Which part of the remaining gap is operationally addressable.
- Which response fits your strategy, capabilities, and economics.
The objective is not to reproduce the benchmarked organization. It is to understand why it performs differently and which lessons can improve your own competitive position.
Why Raw Benchmarking Comparisons in Brazil Can Be Misleading
Scale and capacity utilization
A large local producer may spread fixed cost across greater volume, negotiate better supplier terms, specialize plants, and support a denser distribution network. A smaller operation may need flexibility, imported supply, or a broader product range that creates higher unit cost.
State and regional mix
Performance in the Southeast may not be comparable with performance across the North, Northeast, Center-West, or geographically dispersed national accounts. Customer density, freight, infrastructure, service, and competitive intensity differ.
Taxes and commercial flows
Production location, warehousing, invoicing flows, customer location, channel structure, and product classification can affect delivered economics. Strategic benchmarking should make these differences visible, while formal tax conclusions remain the responsibility of qualified specialists.
Local production versus importing
Local production can improve availability, adaptation, service, and customer trust. Importing can reduce fixed cost, protect flexibility, and provide access to specialized technology. The models should not be compared without considering investment, capacity, supply risk, inventory, and customer value.
Product and customer mix
A company serving high-volume standard applications may appear more efficient than one supporting customized products, strategic accounts, complex projects, or regulated customers.
Direct versus indirect channels
A distributor-led model may show a lower internal sales and service cost while shifting inventory, credit, technical support, and customer ownership into channel margins.
Labor and organizational design
Role specialization, outsourcing, management layers, incentives, decision rights, talent location, union arrangements, and field coverage can all influence apparent productivity.
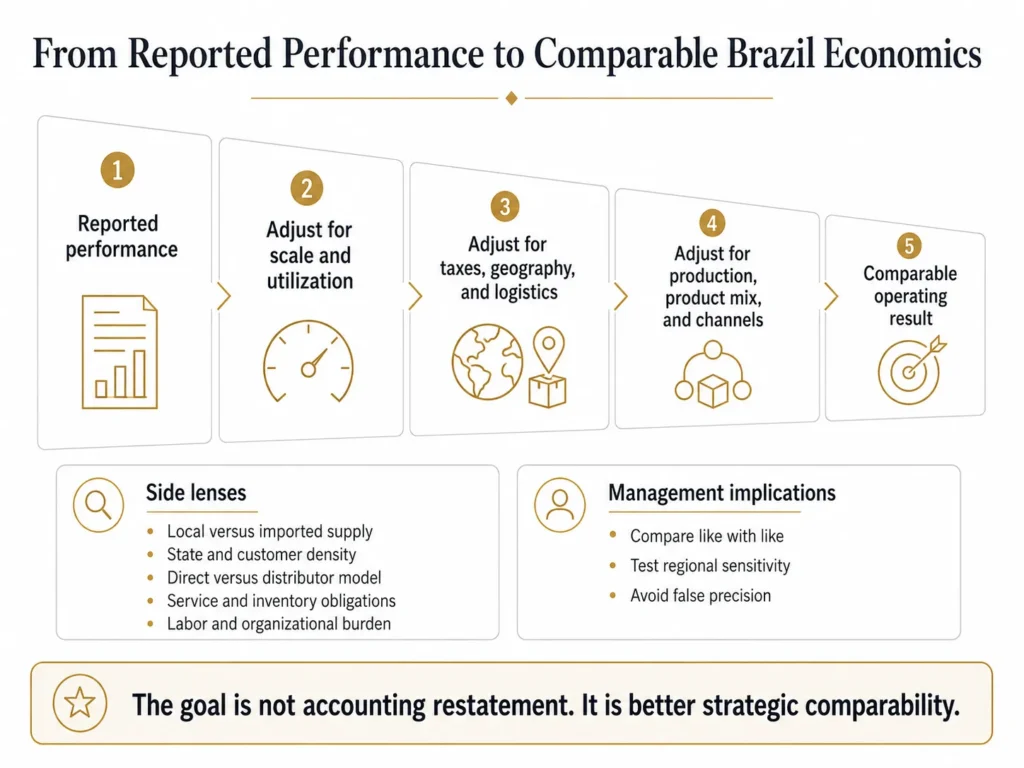
Figure 2. A useful benchmark adjusts reported performance for the economic and operating choices that materially change comparability in Brazil.
Benchmark the Operating Model, not Only the KPI
A performance measure tells you where to investigate. The operating model explains how the result is created.
Depending on your decision, we may compare:
- Plant configuration and capacity utilization.
- Local production, assembly, importing, and contract manufacturing.
- Supplier strategy and sourcing mix.
- Inventory location and replenishment.
- Warehouse and logistics networks.
- Salesforce structure and account coverage.
- Distributor, dealer, and integrator models.
- Service footprint and response model.
- Pricing, discounting, terms, and commercial governance.
- Organization, roles, incentives, and decision rights.
- Technology, automation, data, and performance management.
The purpose is to connect the observed result with the system of choices that produces it.
Regional Differences Can Change the Meaning of “Best Practice”
A practice that performs well in São Paulo may not transfer directly to the Northeast, Center-West, or North.
A dense industrial and customer base can support specialized sales roles, rapid service, frequent deliveries, and centralized inventory. A dispersed market may require broader roles, regional partners, higher inventory, longer response times, or a different service promise.
Before scaling a practice nationally, your team should ask:
- Which regional conditions enable the result?
- What demand density is required?
- Which customer types and applications are included?
- What infrastructure and partner capabilities are available?
- How does the cost-to-serve change outside the benchmark region?
- Which parts of the practice are principles and which are location-specific?
The strongest national model may be a common management logic with different regional execution, not one identical structure everywhere.
Choose the Benchmark in Brazil That Matches the Decision
The most visible Brazilian competitor is not always the most useful reference.
Internal leader
Which plant, region, team, channel, or business unit already performs well inside your organization, and what explains the result?
Local competitor
Which Brazilian company performs better in the exact market, customer group, region, or capability you need to improve?
Regional comparator
What can you learn from a similar Latin American operation after differences in scale and context are normalized?
Global best-in-class organization
What is possible at a higher maturity level in manufacturing, service, logistics, sales, innovation, or customer experience?
Adjacent-industry leader
Which company outside your category has solved a similar operational or customer problem more effectively?
Future-state model
Which capabilities will your strategy require in the next stage of growth, even if no current competitor represents the complete model?
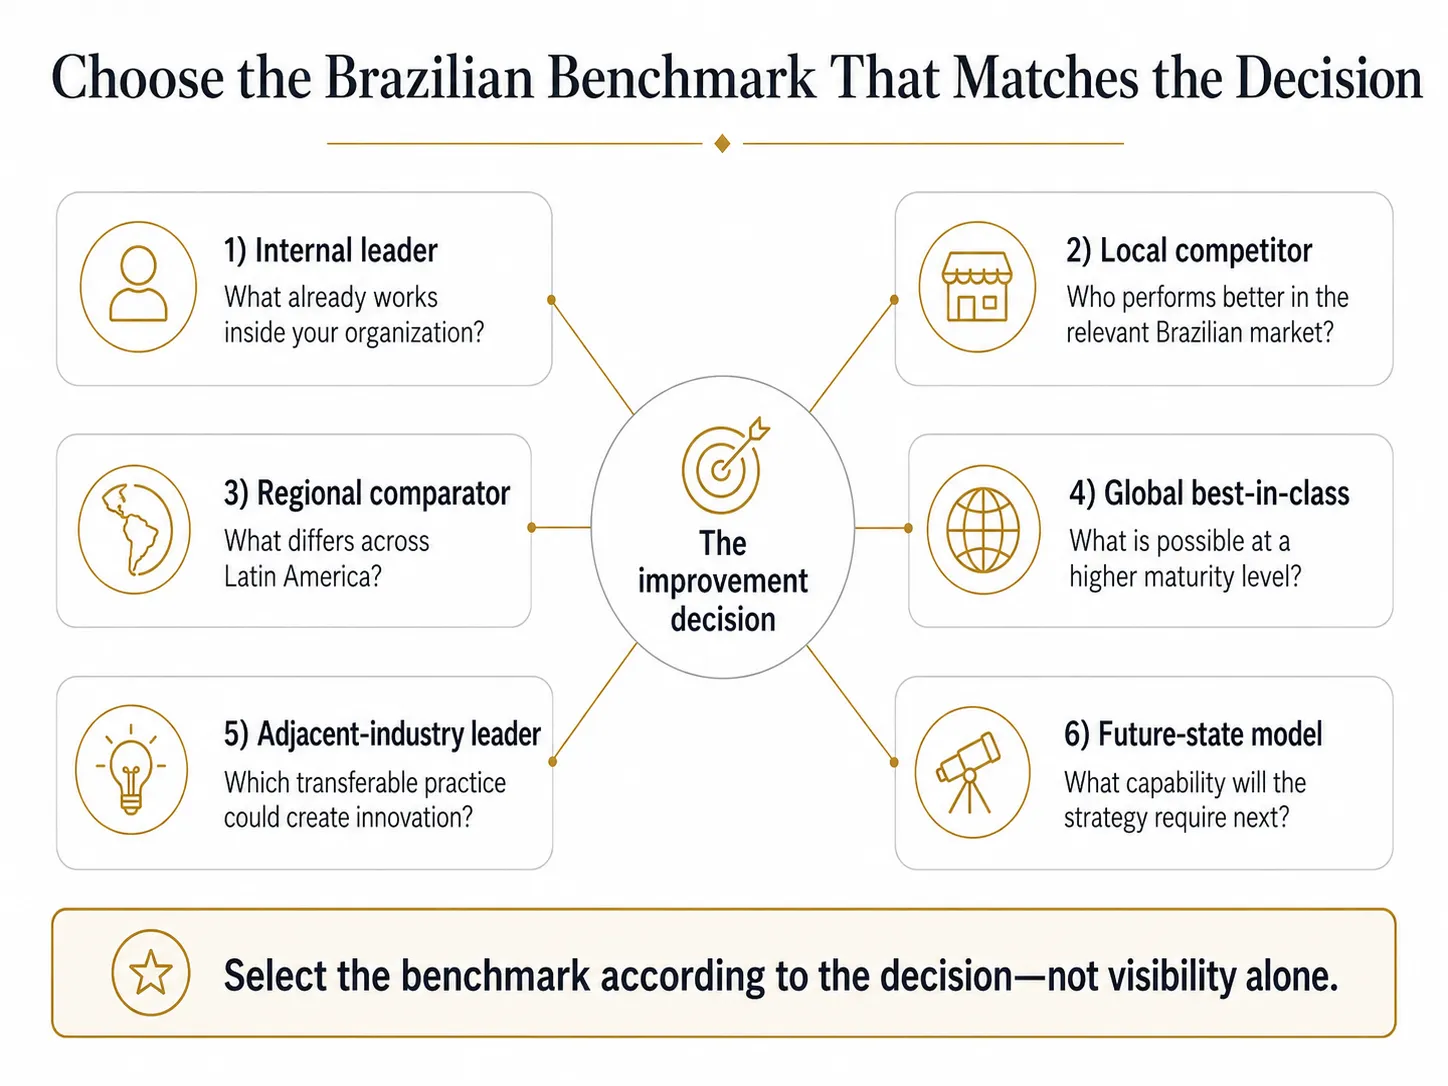
Figure 3. The right reference set may combine internal, Brazilian, regional, global, adjacent-industry, and future-state benchmarks.
Costs Should Be Reconstructed for Benchmarking in Brazil, Not Merely Collected
Competitor cost information is rarely available as one complete verified number. Strong cost benchmarking therefore reconstructs the economic logic from multiple sources.
Relevant cost drivers may include:
- Plant scale and utilization.
- Labor model and productivity.
- Raw materials and supplier terms.
- Imported inputs and currency exposure.
- Freight, warehousing, and inventory.
- Taxes and commercial flows.
- Product complexity and changeovers.
- Scrap, yield, quality, and maintenance.
- Channel margins and customer terms.
- Service, warranty, and technical support.
We distinguish confirmed facts from estimates and hypotheses and use ranges when the evidence does not justify false precision.
Channel Benchmarking in Brazil Requires a Full Economic View
A competitor with lower internal commercial cost may rely more heavily on distributors. That does not necessarily mean its total route-to-market cost is lower.
We may compare:
- Direct and indirect sales coverage.
- Distributor and dealer margins.
- Inventory ownership.
- Credit and collection responsibility.
- Demand generation.
- Technical support and service.
- Customer ownership.
- Pricing authority.
- Geographic reach.
- Conflicts and competing brands.
The key question is which model creates the strongest combination of customer access, control, economics, service, and scalability.
Local Production Should Be Benchmarked as a Strategic System
A local producer may outperform an importer in lead time and availability while carrying more fixed cost, complexity, and capacity risk.
A useful benchmark compares:
- Customer value created by local presence.
- Minimum efficient scale.
- Capacity utilization.
- Product flexibility and localization.
- Imported-input dependence.
- Quality and technical capability.
- Service and response speed.
- Capital and working-capital requirements.
- Management complexity.
- Long-term strategic resilience.
The purpose is not to prove that local production or importing is universally better. It is to determine which model fits the demand, strategy, and economics of your business.
Decide Whether to Match, Adapt, Leapfrog, or Remain Different
Match and implement
Close a high-impact gap when the underlying practice fits your organization and the economics are attractive.
Stage, redesign, or leapfrog
Use a phased capability build, a redesigned process, automation, a new partner model, or a different operating system when the gap matters but cannot be closed by copying.
Adopt selectively
Take the components that create value without importing the full model or its unnecessary complexity.
Remain different, stop, or postpone
Do not close a gap that is structurally irrelevant, economically unattractive, poorly aligned with your value proposition, or dependent on conditions your organization does not have.
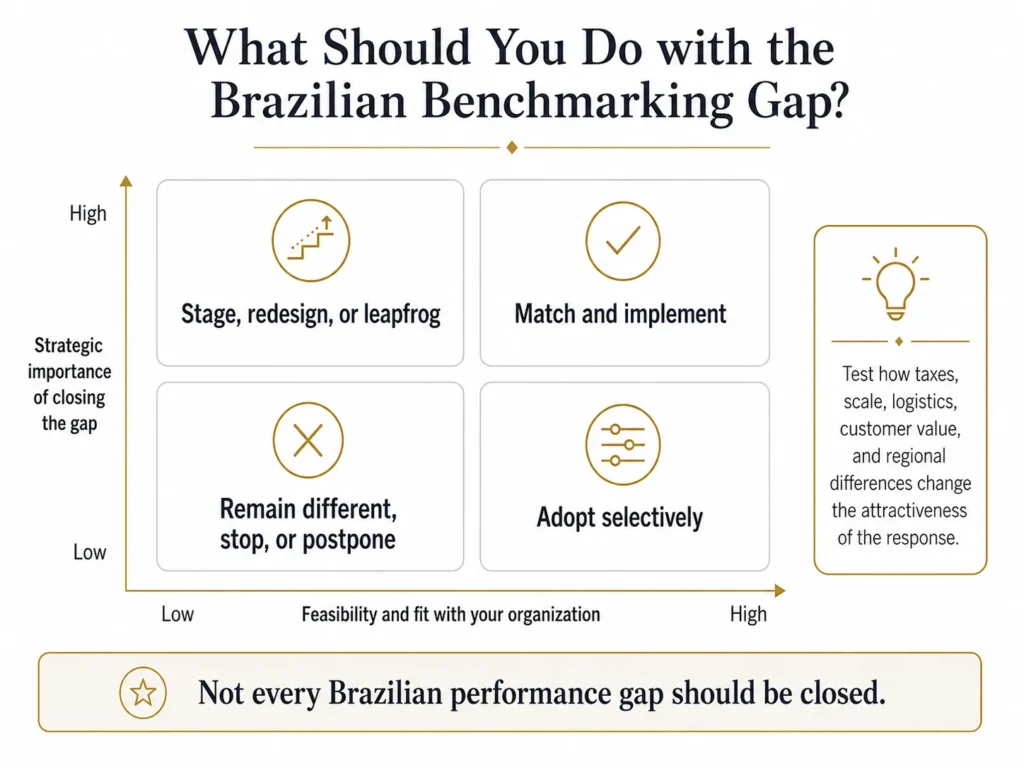
Figure 4. The correct response depends on the gap’s strategic importance, feasibility, economic value, and fit with your Brazilian operating model.
How Midas Builds a Reliable Benchmarking in Brazil
Brazil offers significant public and company information, but the data may be aggregated, inconsistent, difficult to compare, or unable to explain why performance differs.
We may combine:
- Internal operating, commercial, financial, customer, and channel data.
- Company disclosures, facilities, capacity, products, hiring, technology, and investment signals.
- Official economic, industrial, trade, regulatory, labor, and geographic information.
- Interviews with customers, distributors, dealers, suppliers, specialists, former industry participants, and other knowledgeable sources.
- State, regional, cluster, plant, channel, and account-level validation.
- Economic and operational models that test the consistency of the evidence.
We align definitions, periods, units, and scope before drawing conclusions. We identify which findings are verified, estimated, inferred, or still uncertain.
For the complete benchmarking process, visit Benchmarking: How to Compare, Learn, and Improve Your Competitive Position.
How This Page Fits the Midas Benchmarking Cluster
This page owns the Brazil-specific strategic question: how to normalize scale, states, taxes, logistics, production, labor, product mix, and channels before acting on a performance gap.
For regional comparison and cross-country implementation, visit Benchmarking in Latin America.
For a broader strategic explanation of why benchmarking should explain the gap rather than encourage copying, visit Benchmarking That Delivers Real Competitive Advantage.
For the complete commercial offer, engagement model, and deliverables, visit Benchmarking Consulting.
Case Example: Benchmarking Salesforce Strategy in Brazil
The executive challenge
A multinational diabetes-monitoring company wanted to compare its Brazilian sales organization with leading competitors while also understanding how Brazil differed from Argentina, Mexico, and Peru.
A simple headcount or compensation comparison would have been misleading. Customer density, geographic coverage, channels, role definitions, account priorities, incentives, and local sales practices differed across markets.
How we approached the decision
We developed a consistent framework and conducted Brazil-specific research involving competitor sales teams, HR professionals, distributors, pharmacy chains, and other knowledgeable sources.
The analysis included:
- Salesforce structure and roles.
- Headcount and field deployment.
- Compensation and incentives.
- Account and territory coverage.
- Distributor and pharmacy-channel interaction.
- Regional and local sales priorities.
- Differences between Brazil and the other markets.
How the benchmarking findings in Brazil changed the strategy
The company adapted its Brazilian salesforce structure and compensation approach while maintaining a clearer regional logic for roles, priorities, and expected behaviors.
The broader benchmarking program contributed to a 30% increase in sales within one year.
The case demonstrates why Brazil benchmarking requires both local depth and regional comparability. The value came from identifying the performance drivers and adapting them, not from forcing one identical sales model across countries.
“We are extremely pleased with the benchmarking. It helped us reassess our priorities and redirect our resources.”
— Market Segment Leader
“Just to reiterate, this is fantastic. I’m really excited to see such valuable insights and information! Thank you again!”
— Vice President
When You Need Benchmarking in Brazil
- A competitor consistently operates at a lower cost.
- Performance varies significantly across states, plants, regions, or channels.
- You need to compare local production, importing, assembly, or outsourcing.
- Your salesforce or service productivity appears weaker than competitors’.
- You need to benchmark distributors, dealers, integrators, or direct-sales models.
- You are reviewing pricing, discounting, margins, or commercial governance.
- You need realistic plant, service, logistics, or commercial targets.
- You want to scale an internal best practice across Brazil.
- You are considering automation, localization, investment, acquisition, or restructuring.
- Your team disagrees about whether the gap is structural or operational.
Why Midas for Benchmarking in Brazil?
We normalize the comparison before recommending action
We adjust for scale, region, taxes, logistics, production, product mix, channels, labor, and service obligations.
We explain the operating model behind the result
We connect KPIs with processes, roles, technology, incentives, sourcing, capacity, channels, and decision rights.
We combine local depth with regional perspective
Brazil-specific evidence is interpreted within a consistent Latin American framework where regional comparison adds value.
We select benchmarks according to the strategic question
The reference set may include internal leaders, Brazilian competitors, regional peers, global best-in-class organizations, and adjacent industries.
We help you adapt rather than copy
We identify transferable principles, enabling conditions, organizational requirements, and potential unintended consequences.
We translate findings into an improvement roadmap
The engagement ends with priorities, targets, options, owners, capabilities, investment implications, and next steps.
We bring direct benchmarking in Brazil experience
We have benchmarked commercial, operational, cost, pricing, channel, organization, service, and competitive practices in Brazil across industrial, healthcare, technology, automotive, consumer, and regulated markets.
Ethical, Comparable, and Reliable Intelligence
We comply with SCIP’s Code of Ethics, the profession’s gold standard. We comply with applicable laws, accurately disclose relevant identity and organizational information before interviews, avoid conflicts of interest, provide honest recommendations, and promote ethical conduct throughout the engagement.
We do not seek trade secrets, request confidential documents, misrepresent who we are, induce contractual breaches, or encourage sources to violate legal or contractual obligations.
We also protect analytical integrity by aligning definitions, normalizing structural differences, triangulating material findings, distinguishing facts from estimates and hypotheses, and explaining confidence levels and limitations.
Review SCIP’s ethical intelligence guidance and Code of Ethics.
Frequently Asked Questions About Benchmarking in Brazil
Can you benchmark private competitors in Brazil?
Yes. We combine lawful public sources, interviews, customer and channel evidence, supplier perspectives, operational signals, and economic logic. We clearly distinguish verified findings from estimates.
How do you normalize tax differences in your benchmarking in Brazil?
We identify how observable tax and commercial-flow differences affect strategic comparability. Qualified tax specialists should validate formal legal or tax conclusions.
Can you compare plants in different states in your benchmarking in Brazil?
Yes. We can compare scale, utilization, sourcing, labor, logistics, taxes, product mix, complexity, service territories, and customer proximity.
Can you benchmark local production against importing in your benchmarking in Brazil?
Yes. We compare customer value, cost, capacity, flexibility, inventory, supply risk, lead times, investment, service, and strategic resilience.
Can you benchmark distributors and direct-sales models?
Yes. We assess coverage, customer ownership, margins, inventory, credit, technical capability, service, demand generation, control, and scalability.
Can you benchmark salesforce structures and incentives in your benchmarking in Brazil?
Yes. We can compare roles, headcount, coverage, productivity, account priorities, incentives, field deployment, channels, and management routines.
How do you compare regions with different customer density?
We normalize territory size, travel, account density, service requirements, channel support, customer mix, and opportunity potential before interpreting productivity.
Can you benchmark costs in your benchmarking in Brazil when exact competitor data is unavailable?
Yes. We reconstruct cost ranges from multiple independent sources and operating assumptions. We avoid presenting estimates as verified facts.
Can benchmarking support an investment or acquisition decision?
Yes. It can clarify performance potential, capability gaps, operational synergies, investment needs, and whether the target or project can reach the required benchmark.
How long does a Brazil benchmarking project take?
The timing depends on the functions, regions, comparators, interviews, data availability, and strategic questions. We scope the work around your decision and can share preliminary findings in phases.
About the Author
Adrian Alvarez, PhD is Managing Partner at Midas Consulting, Wharton Alumnus, MBA Professor at Universidad Argentina de la Empresa (UADE), and Competitive Intelligence Fellow. He specializes in benchmarking, competitive strategy, competitor analysis, strategic intelligence, market analysis, and executive decision-making under uncertainty in Brazil and Latin America.
He has led benchmarking and competitive-intelligence projects in Brazil across industrial, automotive, technology, consumer, pharmaceutical, healthcare, and regulated markets. He also served as a Board Member of SCIP during the 2009–2011 period.
His work has been published in the United States, Spain, and Germany. You can access his library of strategic insights and published research here
View professional profile on LinkedIn
Selected Brazilian Sources You May Need to Monitor
- IBGE for official economic, demographic, industrial, and regional information.
- Banco Central do Brasil for monetary, credit, exchange, and economic information.
- Ministry of Development, Industry, Trade and Services for relevant trade and industrial information.
- CADE for competition and market-structure information.
- State agencies, company disclosures, procurement platforms, labor and industry sources, associations, distributor evidence, and primary interviews as appropriate.
Turn the Brazilian Performance Gap into a Focused Improvement Decision
You may be trying to understand why a competitor has lower cost, why one state or business unit performs better, whether local production creates an advantage, or which operating practices deserve investment.
You do not need another raw comparison that ignores Brazil’s scale, states, taxes, logistics, production models, channels, and service obligations. You need to understand which gap is real, why it exists, and what your organization should do differently.
In an initial conversation, we will discuss the performance question, regions, functions, comparators, internal data, and strategic decisions involved.
We can then propose a focused Brazil benchmarking engagement with a clear comparison architecture, normalization approach, research plan, collaboration model, timing, and deliverables.